 |
|
Data availibilty
Ogongo
The list below shows which other data is available for this observatory.
Other observatories
The list below shows for which other observatories the following datatype is available:
Time series of plant diversity
(List in North-South Direction)
North-South Direction
 |
 Ogongo (S42) - Time series of plant diversity Ogongo (S42) - Time series of plant diversity
Graphical representation of diversity patterns in space and time
Rainfall [Climate]
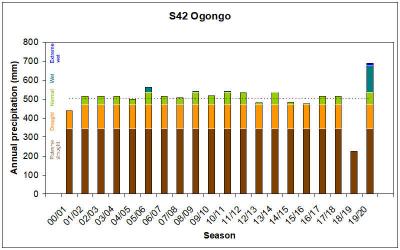
Quality of the rainfall season, calculated for a rainfall season from August to July in the following year, based on data from SASSCAL Weathernet and gap-filled with WorldClim historic data (Fick and Hijmans, 2017). The quality of the season is based on criteria developed by Gibbs and Maher (1967) and Botha (1999) and indicated by colour-coding: Brown: extreme drought, precipitation below the 10th percentile (344 mm), light-brown: drought, precipitation below the 40th percentile (470 mm), green: normal, precipitation between the 40th and 70th percentile (470 and 535 mm), blue-green: wet, precipitation above the 70th percentile (535 mm), and blue: extreme wet years, precipitation above the 90th percentile (676 mm). The stippled line represents the long-term median rainfall (499 mm).
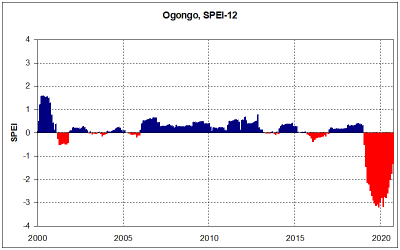
SPEI [Climate]  Standardised Precipitation-Evapotranspiration Index (SPEI) for a 12-months interval.
(ID=93) Standardised Precipitation-Evapotranspiration Index (SPEI) for a 12-months interval.
(ID=93)(created by Ben Strohbach)
The SPEI index is a standardised monthly climatic balance computed as the difference between the cumulative precipitation and the potential evapotranspiration (Vicente-Serrano et al. 2010). For this presentation the SPEI value per month is based on the accumulated values of the previous 12 months. Red bars indicate drought, blue bars humid conditions.
|


 Angola
 Bicuar National Park
 Namibia
 Aussinanis
 South Africa
 Alpha
Alpha Zambia
 Dongwe
 Ogongo
 Alpha
Alpha


